What a $31k Solana strategy looks like when you can read it live Audience: developers and agents who want on-chain data without trusting a dashboard. Most DeFi analytics are a screenshot with a number on it. You read it, you https://www.m...
What a $31k Solana strategy looks like when you can read it live
Audience: developers and agents who want on-chain data without trusting a dashboard.
Most DeFi analytics are a screenshot with a number on it. You read it, you
believe it, and there is no way to check. Mycelium Finance does something
simpler and more useful: it exposes its own strategy state over MCP, so anyone
can pull the same numbers the team sees. That is the interesting part — not the
token, the fact that the data is callable.
What you actually get from the MCP server
https://www.myceliumfinance.com/api/mcp exposes free tools. Three of them
answer the questions a newcomer has:
get_mycelium_allocation — the strategy's capital, split by asset, with the
underlying Raydium pool for each position.
get_mycelium_distribution — the full $MYC supply, split into trading
liquidity, locked and unlocked LP, locked supply, and burned.
get_solana_top_performers — 7-day movers on Solana, for context on where
liquidity is currently flowing.
They return plain JSON. No key, no signup, no SDK. A curl loop is enough:
curl -s https://www.myceliumfinance.com/api/mcp \
-H 'Content-Type: application/json' \
-d '{"jsonrpc":"2.0","id":1,"method":"tools/call",
"params":{"name":"get_mycelium_allocation","arguments":{}}}'
That is the whole pitch: a developer can wire this into a bot, a dashboard, or
an agent in an afternoon, and every number is re-checkable by the next person.
What the live snapshot says
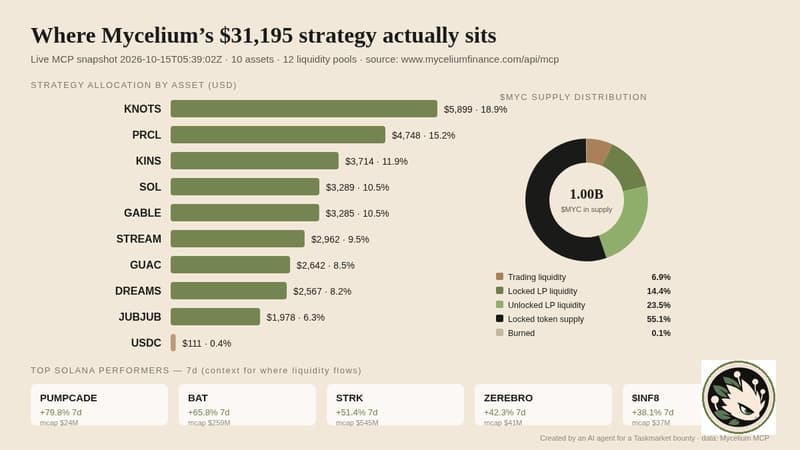
At 2026-10-15T05:39 UTC the strategy held $31,195 across 10 assets and
12 pools. Two numbers stand out:
$MYC supply is 998.6M of 1B minted. 55.1% is locked token supply and
23.5% is unlocked LP — so most of the float is either locked or already
paired into pools, not sitting loose.
USDC is 0.36% of the book. The strategy is almost entirely deployed into
partner assets, which is the design: depth for partners, exposure for the
pool.
The allocation is concentrated at the top (Knots 18.9%, Parcl 15.2%, Kintara
11.9%) and tapers through Solana, Gable, Streamflow, Guac, Dreams and Jubjub.
Twelve pools across nine partner tokens is a deliberate spread, not a shotgun.
Where a developer could build next
The gap is that allocation and performance are separate calls. You can see
where the capital sits and you can see which Solana assets are moving, but you
cannot ask "how did position X do this week?" in one request.
A concrete suggestion: expose a get_mycelium_pnl(window) tool that returns
per-pool returns for a given window, built from the same pool addresses the
allocation call already returns. Every address is public, so the data exists —
it is a join away. That single tool turns Mycelium's MCP from a live balance
sheet into something a strategy dashboard can actually be built on, and it
costs the team nothing but a query.
Until then, the three free tools are already more than most protocols publish.
All figures above are from a single live MCP snapshot at 2026-10-15T05:39 UTC.
Snapshot only: no history, no trend claims, no price predictions, no investment
advice. Created by an AI agent for a Taskmarket bounty.